Assessing if and how an application will scale - and scale the way we expect it to - is not straightforward. We do have to define the scaling traits (are we talking about concurrent users? increase in data size? increase in data volumetry? increase in activity? all of those?). We also have to define the protocol we want to assess hypothesis with, the figures we want to surface and their matching reading grid, the infrastructure we need to setup, …
To cope with those yards, some dedicated frameworks emerged and smooth the path for new-comers. K6 from Grafana Labs is one of them. Let’s see how to operate it through a compelling use case.
Landscape
We want to exercise an application that serves capabilities through REST, gRPC or websocket. K6 acts as the load testing engine, feeding InfluxDB with test results. Grafana fetches those results along the way and ease interpretation thanks to its built-in dashboard facilities.
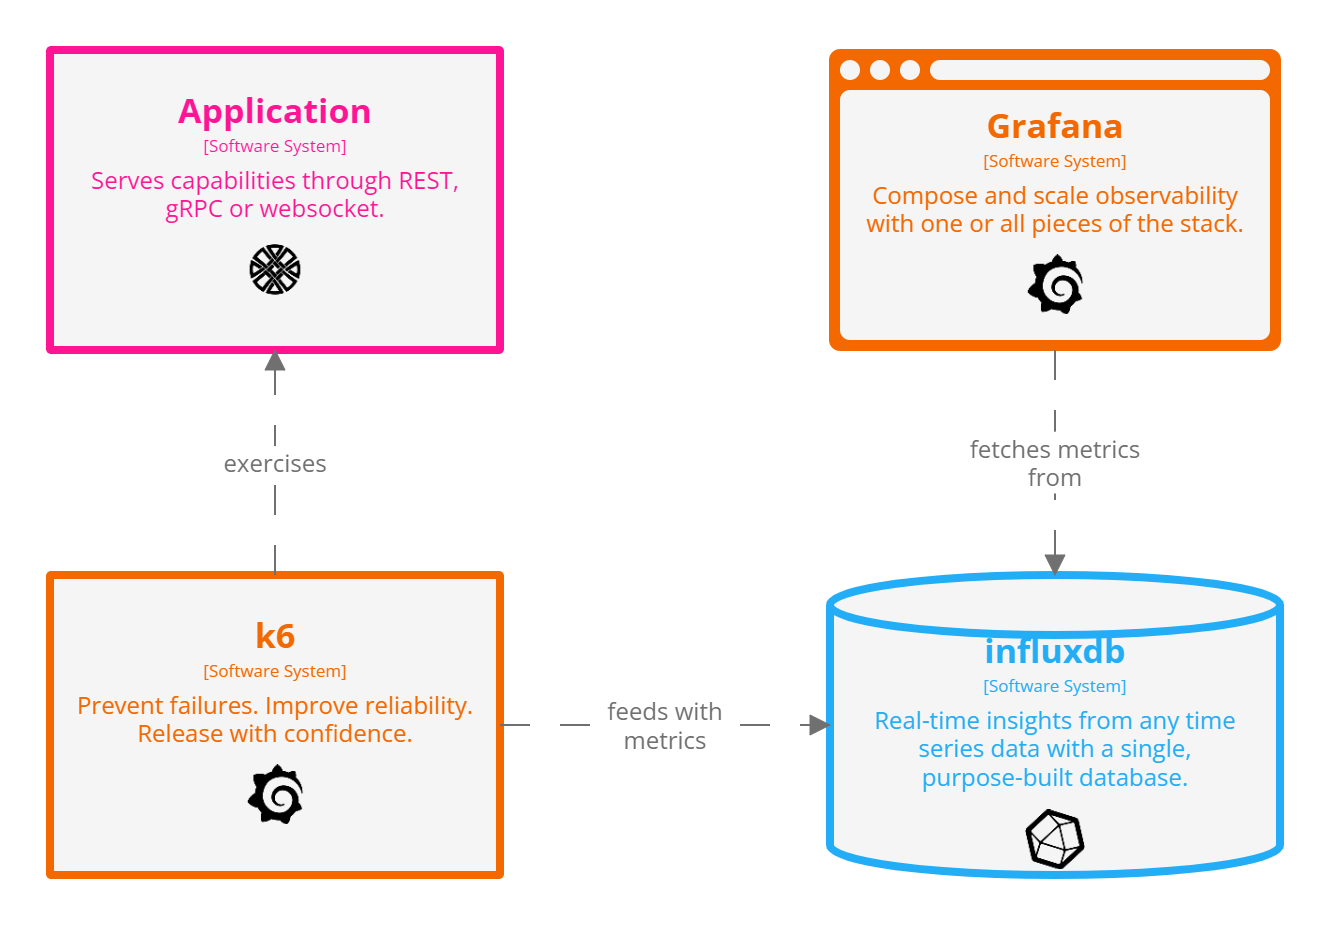
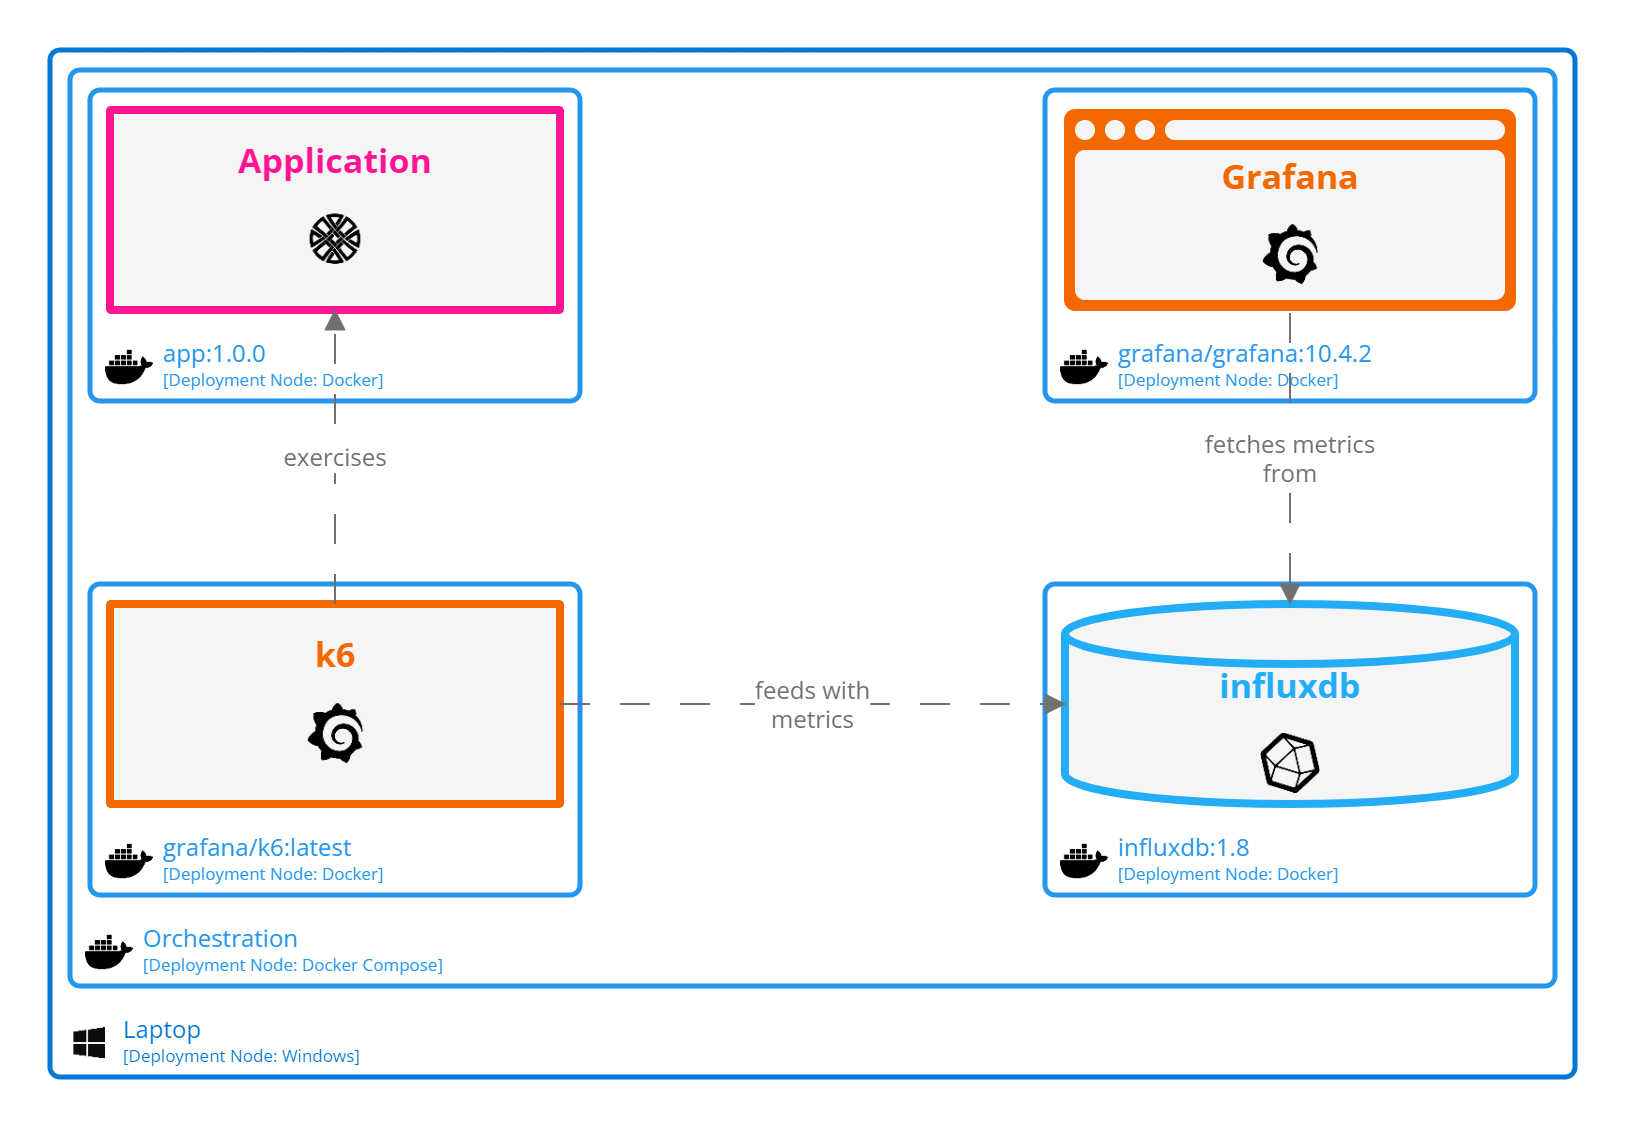
Luckily, the whole stack can be containerized and thus locally deployed through docker compose.
Assume we focus on testing FastAPI hello and httpbin path operations. Resulting K6 script looks like following snippet.
|
|
You may have noticed we picked the
latestversion of theAPI, even ifAPIexposes a bunch of versions. Regression tracking can be easily achieve by exercising multiple versions of the same route instead to gauge impact of said evolution. Once again, organize your testing campaign such as it is explicit downstream what you are focusing at and provide matching reading grid.
Full script.js is provided in Annex.
Single user
Assess how our application accommodate load testing implies we know how it operates for a single-user. We may already have this insights but it is smarter for comparison to draft a baseline leveraging the same underlying tooling to mitigate differences between stack. This way, we are more comfortable to compare runs, as we are not comparing single user within Apache JMeter to multiple users within K6 environment. Thus, the importance when decision regarding testing framework will have to be made to keep in mind which types of use cases we would like to cover and which are covered by the stack we pick. One of this dimension may be to ensure we can test locally deployed application through docker compose and remotely deployed application through Kubernetes.
Experiment
K6 syntax allows to define stages to ramp up users by defining both duration and target.
Let’s assume we define the following scenario.
|
|
To ease comparison, we keep the same split for all experiments even if split is artificial here when the number of users does not vary between consecutive stages.
Testing campaign is bound to hellofastapi.
Full compose.yaml is provided in Annex.
|
|
docker compose up the stack and wait for completion.
Live results can be browsed through Grafana UI.
VUsstands for Virtual Users.
RPSstands for Requests Per Second.
Analysis
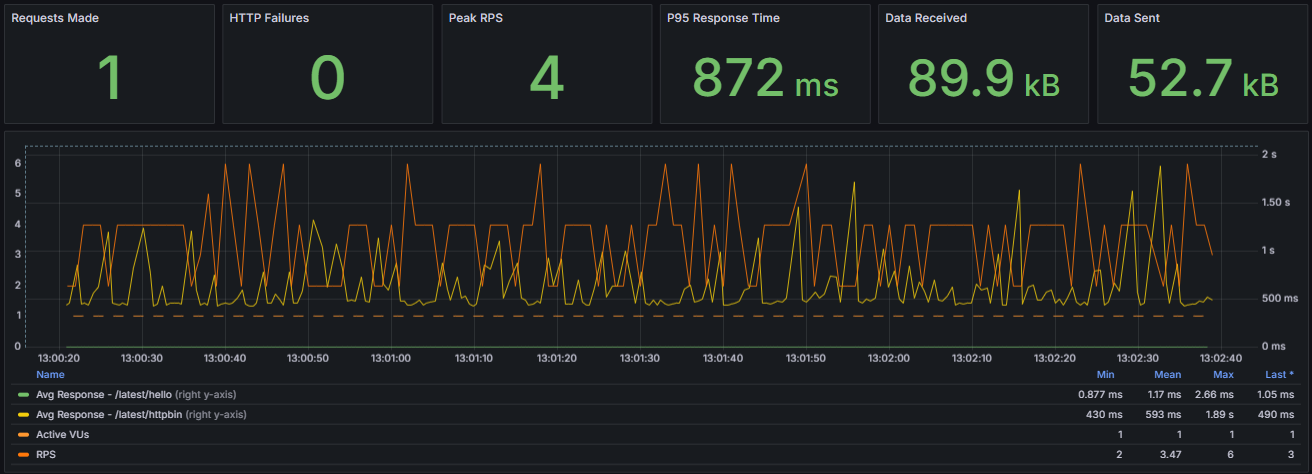
Nothing fancy here to notice. Values seem to be on the range we expect. Active virtual user is constant to 1 as expected. Let’s try to scale now we have our baseline.
Load testing
Experiment
We slightly amend script to simulate a leading ramp up stage up to 20 users, followed by a ramp down in 2 stages, starting with a target of 10 users then moving down to 0 users.
|
|
Figures used there are not tied to real-life usage but ideally they should as it does make any sense to test hypothetic use cases. Assuming you already defined the Service Level Objective, aka the SLO, for your application, you should leverage it to craft your stages. If you do not have one, you may start the other way around and experiment with stages to shape your SLO.
Here we keep the same version of the application. Keep in mind that spot the diff game is far easier when you keep amount of moving variables small. Comparing single user usage for version 1.0.0 to multiple users usage for version 1.5.0 will be difficult and even does not make any sense at all.
|
|
Analysis
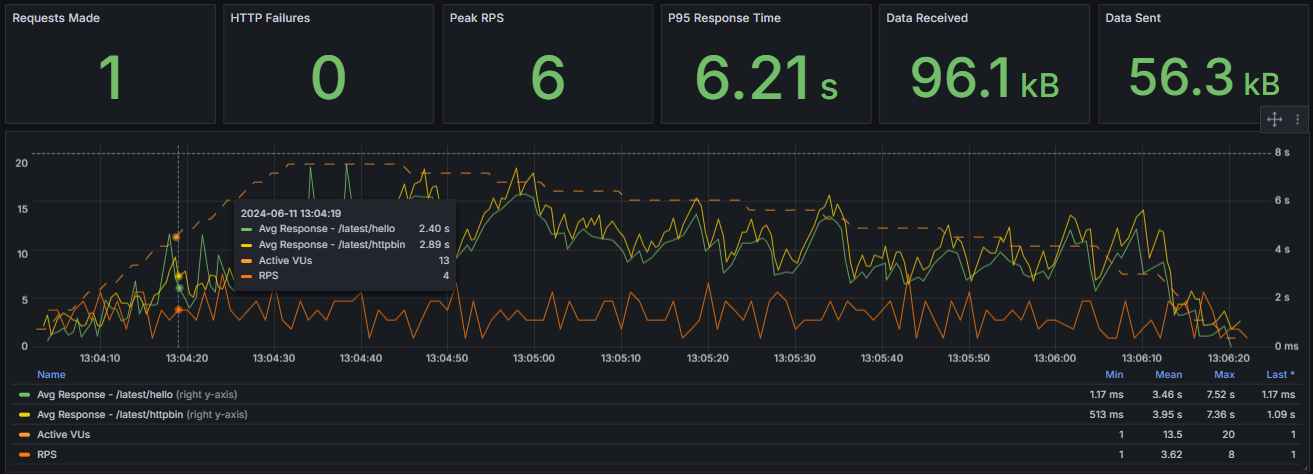
All calls are damn slow. And when we say all, it also applies to the ones that literally do nothing, namely hello.
|
|
What’s the hell is going on within our application to experience such poor scaling..? Looking at RPS, we may notice that it does not scale the way we should have expected compared to the single-user scenario. In fact, mean is even less. Why is our code not scaling properly?
For Unit Testing we enforce
FIRSTparadigm (Fast, Isolated, Repeatable, Self-validating and Timely), especially isolation stressing that every single test must be side-effects free to both speed up execution and determinism. Integration testing or load testing obey different set of rules. By their inherent nature, they focus on side-effects. It is no more assessing service UX in isolation but how an ecosystem handles use cases. Thus the importance of testing as a whole, as tracks A and B could perform independently fine but tracks A and B when interleaved can collapse an entire ecosystem. Some would even argue for integration testing to adopt this approach first.
Investigation
Issue
Looking back again at our path operations, focusing on httpbin (as hello seems to be too simple to be the root cause), we noticed this inner call to the external httpbin.org service provider.
|
|
Should it be this service that badly performs? Or perhaps the way we use it? Or the way we call it? I/O operations are often good candidates for bottleneck. Remembering our low RPS, we decide to explore requests documentation and find out that it does not handle async calls, ending up slowing down the whole system. Definitively not what we expect, so try to see how we can fix this.
Fix
After some googling, we found out that httpx could be a good fit to rewrite our request code with as it provides built-in async support. Here we go.
|
|
Experiment
Same as before, but using the patched application.
|
|
|
|
You may have noticed we stick to SemVer obeying the
M.m.fpattern, and thus bump thefversion accordingly when we rebuild our container. It allows us to easily navigate back and forth between the two application flavors to replay testing campaign and assess results. It would make sense here to replay single-user scenario with the patched application to shape a new base-line and see if and how it improves in such use case.
Analysis
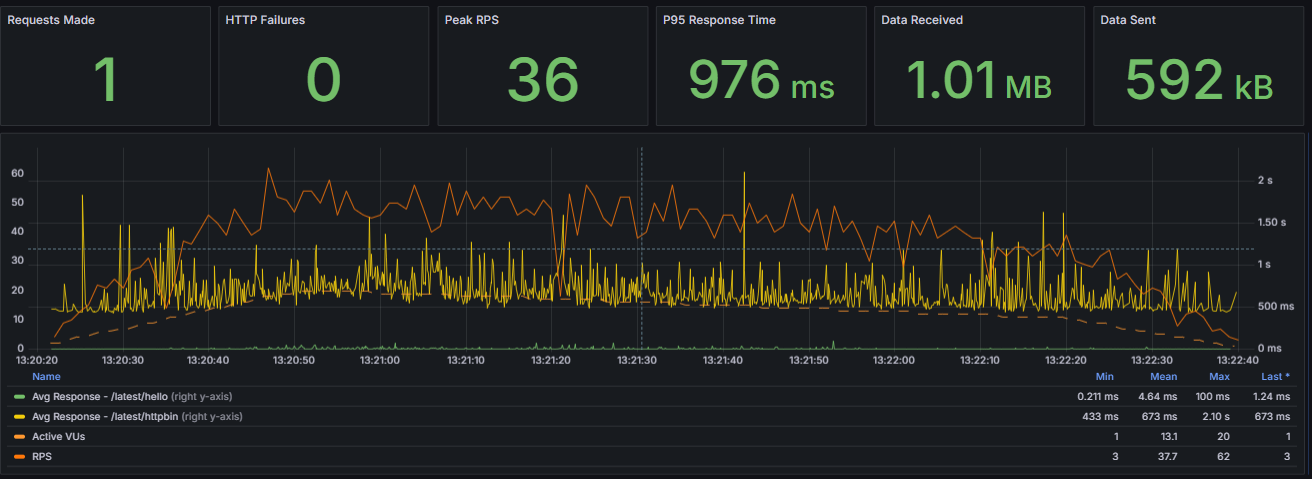
Dashboard looks a lot better with unleashed RPS (encouraging 10x factor) and the expected performance for both path operations, especially hello back to the flat line shape and better httpbin distribution. Mission completed.
Closing

It is important to gauge a journey to be able to visualize where we started from, places we passed through and eventually where we land. Stitching all testing campaigns using the same timeline and scale to ease comparison makes improvement obvious. Even if 2nd and 3rd run shapes look alike, we are not visualizing the same variables. Peaks are now for RPS and plateau for path operations. We do hear QA seasoned folks from here, stating that for completeness we should have run a 4th campaign with single user and patched application scenario to assess multi-user patch does not break single-user experience and to effectively compare figures from 3rd run. This will become our new base line as well. And to be fair, they would be right. Software development is a never ending journey, but blog post needs to have an end. Otherwise, how one could write on another topic…
Annex
Script
|
|
Compose
|
|
